


Learning JavaScript and DOM with Console
In this tutorial, you are going to learn what a console is, and more importantly, how you can leverage it to learn JavaScript and DOM quickly. So let’s get started.
Console?
A console is not a specific project or a command-line terminal, nor is it a Xbox 360 or PS3 (though learning JavaScript and DOM on a game console will definitely be awesome 🙂 ). It is a separated window in a browser that let you inspect all kinds of information about JavaScript objects and DOM objects of the displaying web page, and it exposes an object of the same name (i.e. console) to that page, whose methods can be called to output information of your choice to the console window.
What’s Wrong with alert() and My Home-made log()?
You might ask, “I can display all sorts of things with alert(), what’s the point of console?” It’s true that alert() is a quick-and-dirty way to display variables, but it has a major problem: it steals focus, which will render it useless when mouse interaction or keyboard interaction is involved. That’s not the end of the story, alert() is only good at displaying primitive variables(i.e. strings, numbers, booleans), when trying to display an object, you will be prompted with something like “[object Object]”.
“Fine, I’ll write a custom log() function, which will nicely convert all kinds of variable into meaningful strings and inserts them directly into the document, so it won’t interfere with any interactions. Done, no console is needed.” If that’s what you are thinking, well, I wish things could be that easy, but converting objects into meaningful strings is not an easy task. You’ll have to establish a sophisticated logic, which deeply recursively iterates objects (which may also contain objects) to capture their inner structures, and displaying these structures is not an easy task too.
What Makes Console So Different?
A picture is worth a thousand words. So let me show you a couple of snapshots. I’ll use Google Chrome to demonstrate console, you can access it by pressing Ctrl + Shift + I, and then click the “Console” tab (the last one).
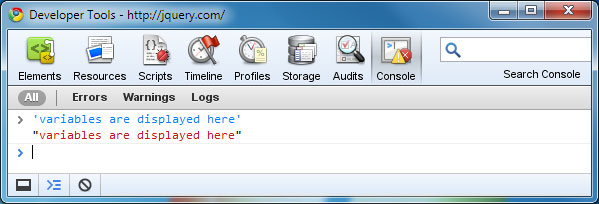
Console is a Separated Window
Which means it will not interfere with mouse interaction or keyboard interaction, and it doesn’t “pollute” the page.
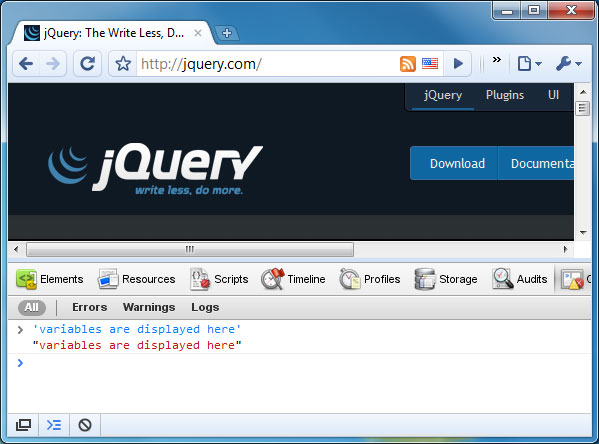
Console Can Also Dock to the Main Window
If you don’t have dual monitors, this is the way to go.
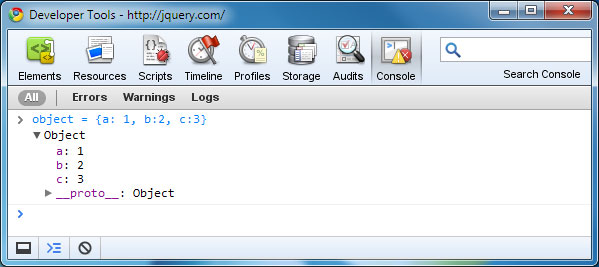
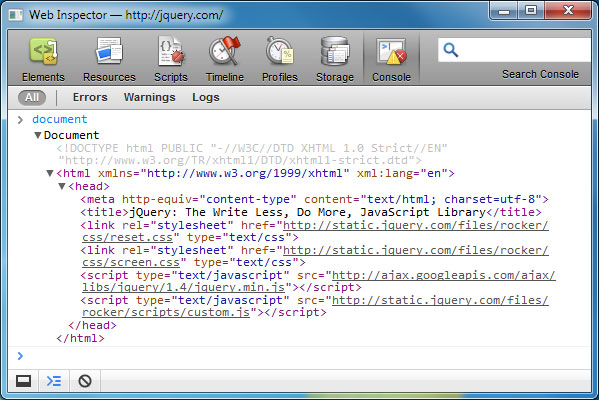
Console Displays Objects Tree-like
Objects are displayed tree-like, and properties can be toggled.
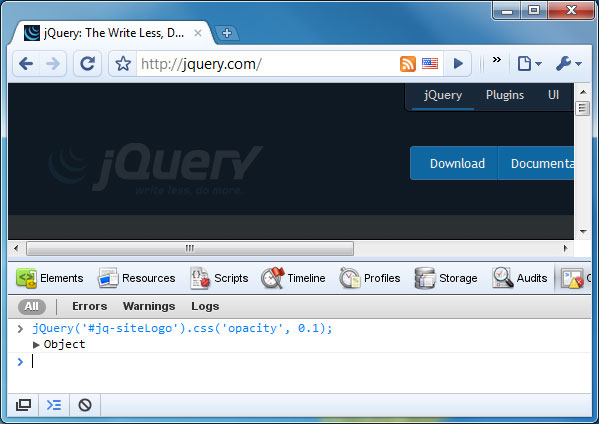
Console Has Access to All Variables Defined by the Environment and You
This is the coolest feature of console. It gives you full access to the page.
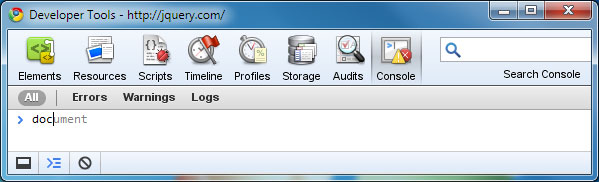
Console Auto-completes Your Typing
So that you can focus on experimenting, and don’t have to spend too much time on typing.
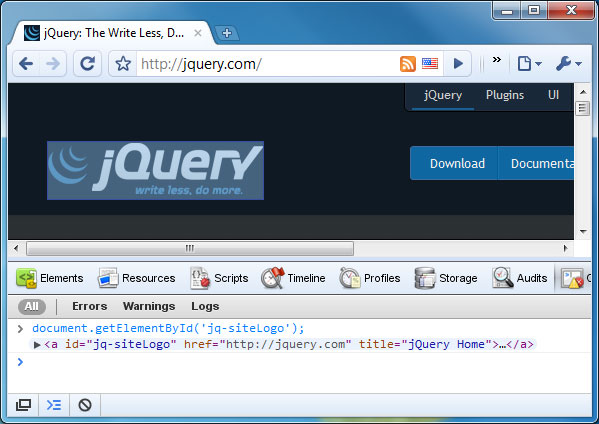
Console Indicates DOM Elements Visually
This is another cool feature of console. Move your mouse over the DOM element in the console, it will be highlighted in the page. So it’s a strong indication that what DOM element it actually refers to.
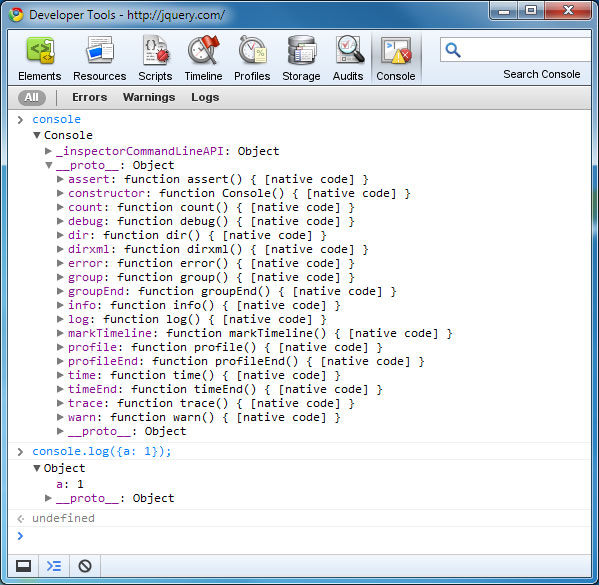
Console Exposes a console Object
We will look at this object in great detail later on.
Cute, But I Don’t Use Google Chrome
Don’t worry, Google Chrome isn’t the only browser that supports console. But even if you do use Google Chrome, the following sections still help, because you may want to learn different quirks about different browsers, and knowing how to invoke console on those browsers become important.
Safari
Safari5 has an almost identical console, which can be accessed by pressing Ctrl + Alt + C. The one in Safari4 isn’t as helpful. It displays objects as “[object Object]”. A workaround is introduced in the section labeled “IE”
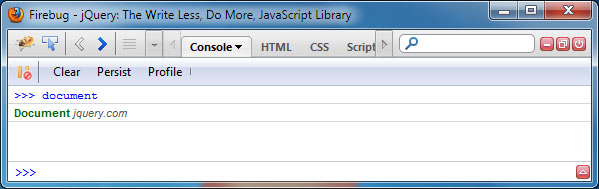
Firefox
Firefox has an excellent extension called Firebug, which is arguable the father of modern developer tools. You should first installed it in Firefox, after which, you can access it from the status bar. To see more about a DOM element in the console (e.g. the document object in this example), you need to click on it, and Firebug will switch to another tab, which contains all properties of that DOM element.
Opera
Opera has its own integrated developer tool called Dragonfly. You can access it from “Tools – Advanced – Opera Dragonfly”. Dragonfly displays objects as “[object Object]”, but you can click on them to view their inner structures. Unfortunately, this only works for objects whose properties are enumerable. Dragonfly doesn’t highlight DOM element when you hover the mouse over the returned DOM element, making it less helpful.

IE
IE8’s integrated developer tool can be accessed by pressing F12. It isn’t as helpful as previous ones. It doesn’t highlight DOM elements, no auto-completion what so ever, and worst of all, it displays objects as “[object Object]” which is not clickable, making it impossible to examine objects’ structures directly. For IE6 and IE7, Microsoft released a developer tool called Internet Explorer Developer Toolbar, which unfortunately doesn’t have a console at all.
But don’t worry, Firebug to the rescue! Fortunately, Firebug team created a cross-browser version of Firebug that works with all major browsers. It’s called Firebug Lite. It has a bookmarklet version and a script file version. Bookmarklet lets you invoke the console on any website, whereas script file lets you invoke the console before your code sends variables to it.
Since Firebug Lite is not part of browser, it isn’t “privileged”, which means it can’t do things like getting the line number of a particular function call, profiling for a chunk of code and some other things that need low level support, but they don’t cover the fact that Firebug Lite has a great console.
OK, I’m Sold. How do I Use it Exactly?
If you want to examine a JavaScript object or a DOM element, console is the definite way to do it. As you may have guessed, there are two ways to use a console: you either type directly in it, or your use the console object in your code.
The latter is desirable, because you may forget a particular characteristic the test code demonstrates, in which case you can recall it quickly just by reviewing that code, which is saved in file. Typing directly in console is more like a one-shot deal, and it’s only suitable for very trivial code.
The console Object
If a browser supports console (either natively or via Firebug Lite), it will expose an object called console to your JavaScript code. You can invoke its various methods to display various aspects of information of your code to the console window.
Let’s see what methods the console object has and what they do.
First, we should establish a test environment:
	<!-- Include Firebug Lite if necessary -->;
	<!-- <mce:script mce_src="https://getfirebug.com/firebug-lite.js" type="text/javascript"></mce:script> -->

	<!-- Your test file goes here -->
	<script src="test.js" type="text/javascript"><!--mce:0--></script>
console.log()
This is the method you will use most of the time. It will output its arguments to the console, and yes, it accepts arbitrary number of arguments. When displayed, they are separated by space. It also supports printf-like string substitution patterns, which should be familiar to C/C++ programmer.
var s = 'string';
var i = 1;
var f = 3.2;
var o = {a: 1, b: 2, c: 3};

console.log('string', s, 'integer', i, 'float', f, 'object', o);
console.log('string %s integer %i float %f object $o', s, i, f, o);
.jpg)
console.info() / console.warn() / console.error() / console.debug()
These methods are basically the same as console.log(), but they assign messages to different categories (e.g. warning category, error category, as their names suggest). console.info() is identical to console.log() in Google Chrome, for it doesn’t have an “info” category. console.debug() is designed to also output an hyperlink which points to the line where it was called, and it’s also identical to console.log() in Google Chrome, which outputs this hyperlink for all log()-like methods.
var s = 'string';
var i = 1;
var f = 3.2;
var o = {a: 1, b: 2, c: 3};

console.debug('string', s, 'integer', i, 'float', f, 'object', o);
console.info('string', s, 'integer', i, 'float', f, 'object', o);
console.warn('string', s, 'integer', i, 'float', f, 'object', o);
console.error('string', s, 'integer', i, 'float', f, 'object', o);
.jpg)
console.assert()
This method acts a bit like assertions in unit testing. It tests whether the first argument is true or not. If it is, it will do nothing, otherwise, it will output an error message consisting of the other arguments.
console.assert(true, 'this will output nothing');
console.assert(false, 'this will generate an error message');
.jpg)
console.dir() / console.dirxml()
These two methods are designed to display JavaScript objects and DOM elements, respectively, as lists. They are identical to console.log() in Goole Chrome. We will use Firebug as an example.
var o = {a: 1, b: 2, o: {a: 1, b: 2}};
console.log(o);
console.dir(o);

var div = document.createElement('div');
div.innerHTML = '<span>content</span>';
console.log(div);
console.dirxml(div);
.jpg)
console.trace()
This method will outputs the stack of function calls at the point where it is called. Confused? It’s clearer with a code example. Notice that console.trace() is not well-supported by Google Chrome (which just outputs the caller function), so we will still use Firebug as an example.
function a() {
	b();
}
function b() {
	c();
}
function c() {
	console.trace();
}
a();
.jpg)
console.group() / console.groupEnd() / console.groupCollapsed()
These methods are designed to structure messages. They indent messages generated between console.group() and console.groupEnd() and nest them in a block that can be toggled. You can pass arbitrary number of arguments to console.group(), which will be displayed as the title of the block. console.groupCollapsed() is the same as console.group(), except that it collapses the block by default, and it’s only supported by Firebug.
console.group('string methods');
console.log('substr', 'string'.substr(1,3));
console.log('substring', 'string'.substring(1,3));
console.groupEnd();

console.group('array methods');
console.log('slice', [1,2,3,4,5].slice(1,3));
console.log('splice', [1,2,3,4,5].splice(1,3));
console.groupEnd();
.jpg)
console.time() / console.timeEnd()
As you may have guessed, these methods measure how much time have elapsed between their invokings. Many developers use them to test function performence. They accept an argument as an ID, so that console.timeEnd() knows which timer created by console.time() to stop, and it also gets displayed as a title before the actual time.
function fn1() {
	var fn = function() {};
}
function fn2() {
	var fn = new Function();
}

console.time('fn1');
for(var i = 0 ; i < 1000 ; ++i) {
	fn1();
}
console.timeEnd('fn1');

console.time('fn2');
for(var i = 0 ; i < 1000 ; ++i) {
	fn2();
}
console.timeEnd('fn2');
.jpg)
console.profile() / console.profileEnd()
These methods turn on/off the JavsScript profiler, which scrutinizes function calls in great detail. Firebug has a clearer profile result in my option. console.profile() accepts an argument as the title of the profile result.
function fn1() {
	var fn = function() {};
}
function fn2() {
	var fn = new Function();
}

console.profile('fn');
for(var i = 0 ; i < 1000 ; ++i) {
	fn1();
}

for(var i = 0 ; i < 1000 ; ++i) {
	fn2();
}
console.profileEnd();
.jpg)
console.count()
This method will count the number of times it have been called. It accepts an argument as an ID to support multiple countings.
function a() {
	b();
	c();
	console.count('a()');
}
function b() {
	c();
	console.count('b()');
}
function c() {
	console.count('c()');
}
a();
b();
c();
.jpg)
console.exception() / console.table()
Firebug supports two addtional methods that are not supported by Google Chrome or Safari. console.exception() will output its first argument as an exception object along with its function call stack, and the other arguments constitute the message. console.table() will output its first argument, which should be array of arrays or list of objects, in a tabular layout. It also accepts a second argument, which specifies columns and/or properties to be displayed. See more of console.table() here.
Since these methods are not widely supported. You should avoid use them.
function a() {
	b();
}
function b() {
	c();
}
function c() {
	throw new Error('something is wrong');
}

try {
	a();
} catch (e) {
	console.exception(e, 'error catched');
}
.jpg)
var a = [
	['a1', 'a2', 'a3'],
	['b1', 'b2', 'b3'],
	['c1', 'c2', 'c3']
];
console.table(a);

var o = {
	div: {tag: 'div', content: 'div content'},
	p: {tag: 'p', content: 'p content'},
	span: {tag: 'span', content: 'span content'}
};
console.table(o);
.jpg)
Conclusion
Console can be a great tool for your to learn JavaScript and DOM. If you haven’t used it before, you should start now. It will accelerate your learning speed, and it is worth the time to get familiar with console. That’s all. Thanks for reading this tutorial.
If you are a new web design, then you should try testking ccnp tutorials. We have included the expert reviews, tips and resources in our testking ccie tutorials and testking ccna guides to help you learn how to create inspiring minimal web-designs.
This entry was posted on Monday, August 2nd, 2010 at 11:01 and is filed under Tutorials. You can follow any responses to this entry through the RSS 2.0 feed. You can leave a response, or trackback from your own site.
Great overview. One thing I hate about the Consoles is that none of them have these great features in multi-line mode. Features I’m referring to: color-coding, auto-complete and code insight.
You should know for sure if you are writing something. Opera Dragonfly highlights DOM elements, has autocomplete and other features like adding CSS properties which Chrome/Safari don’t offer. And in contrary to what you say it doesn’t need installation (unlike firebug). And extended console functionality is being worked on as well.
Hi, Sp.Shut. Thanks for pointing it out.
When I say highlighting DOM elements, I mean highlighting DOM elements in the console result. It does highlights DOM elements of the DOM tree in the DOM tab, but not for returned DOM elements like “document.getElementById(‘id’)” you type into the console.
As for auto-completion and installation. I was wrong. I’m sorry I didn’t look into it deeper. Dragonfly does support auto-completion, after typing some characters, press the tab key, and Dragonfly auto-completes it (though not as intuitive as Chrome). Dragonfly is also integrated into Opera. It can be accessed from Tools – Advanced – Opera Dragonfly, but you can also optionally install a debug menu plugin to access it more conveniently. I thought it was a necessary step to use Dragonfly. Sorry about that.
Thanks again. I will contact Tuttoaster to let me edit the tutorial.
@Gavin
Thanks for reply!
Actually Dragonfly highlights elements in console when you type document.getElementById(�id�) ;);
And to autocomplete you have to press up or down buttons, not tab.
Otherwise great article! That’s something they don’t write much about.
Hi, Sp.Shut. What’s your Opera and OS version? Opera 10.6 under Windows 7 x86 doesn’t highlight DOM elements in console. I double checked that. Clicking on strings like “[object HTMLDivElement]” only brings up a properties panel.
As for auto-completion, pressing up or down button brings back history commands, that’s not auto-completion. After typing “doc”, you can press the tab key to expand it to “document”.
Do you use Mac? Though I’m sure it behaves that way under Mac OS.
Enhorabuena por tu blog. Hay partes del art�culo que no entend� muy bien, pero ya lo releer�. Jejeje. Saludos desde Palma de Mallorca.
http://www.amidaweb.com/
http://www.amidaweb.com/blog/home/