


Creating Bar Graphs using jQuery UI
In this tutorial we are going to leverage the power of jQuery UI and create a slick bar graph. So lets get started !!
Setting up workspace –
This tutorial already assumes you know jQuery and basics of jQuery UI. First goto jQuery UI website and download your copy of jQuery. Feel free to download any theme you like.
- Now import jquery and jquery-ui.custom.min.js in your html file, available in the js folder of the download.
- Now goto css folder and link the jquery-ui-1.8.2.custom.css file in your project.
- Finally create graph.js file in which we will code our bar graphs and import the script in our html page.
So far our code looks like –
<link rel="stylesheet" type="text/css" href="css/custom-theme/jquery-ui-1.8.2.custom.css" />

<script type="text/javascript" src="js/jquery-1.4.2.min.js"></script>
<script type="text/javascript" src="js/jquery-ui-1.8.2.custom.min.js"></script>
<script type="text/javascript" src="js/graph.js"></script>
Step 1
Now either we can create a jQueryUI plugin or a jQuery one. For this tutorial, we will create a jQuery one. Before that open up jquery-ui-1.8.2.custom.css and the following code. The below will be the styling for our graph’s background and bar graph’s bar property.
.ui-widget-bg { border-top: 1px dotted #aed0ea; font-size:9px;   }
.ui-widget-bar {position:absolute;zIndex:10;bottom:0;font-size:10px; }
Step 2
Now we will create a div that will be our graph and add some basic styling to the html file.
<!DOCTYPE html PUBLIC "-//W3C//DTD XHTML 1.0 Transitional//EN" "http://www.w3.org/TR/xhtml1/DTD/xhtml1-transitional.dtd">
<html xmlns="http://www.w3.org/1999/xhtml">
<head>
<link rel="stylesheet" type="text/css" href="css/custom-theme/jquery-ui-1.8.2.custom.css" />
 <script type="text/javascript" src="js/jquery-1.4.2.min.js"></script>
<script type="text/javascript" src="js/jquery-ui-1.8.2.custom.min.js"></script>
<script type="text/javascript" src="js/graph.js"></script>

<title>CSS Graphs</title>
<style>
#container { width:960px; margin-left:auto; margin-right:auto; margin-top:100px;  }
</style>

</head>

<body>

<div id="container">
<div id="graph">

</div>
</div>

</body>

</html>
Step 3
Now we will code our jQuery plugin. First of all we will create the basic structure and add options.
$.fn.graph = function(options){
	var defaults = {height:300,width:500,data:'',categories:'',legend:"Graph"};
	var options = $.extend(defaults, options);

    }
Our options will consists of –
- height – the height of the graph.
- width – the width of the graph.
- data – the values of the bars.
- categories – categories or labels of the data.
- legend – Heading of the graph
Step 4
Now we are going to create the widget of the graph. In jQuery UI high level widgets uses ui-widget class. The main parent consist of ui-widget class which gives a consistent UI to all it’s nodes. We will not add ui-widget class to the main element that is calling the pluign but we will wrap the calling element into a div with class ui-widget.
var root = $(this).addClass("ui-widget-content");
root.wrap("<div class=' ui-widget ' />");
var parent = root.parent();
Since root is where actual graph will be, we will add ui-widget-content to it and wrap it in a div.
Step 5
Now we are going to set the properties of the graph from the options we have provided plus some of our own.
parent.prepend("<h3 class='ui-helper-reset ui-widget-header '>"+options.legend+"</h3>");
parent.css({height:options.height,width:options.width});
root.css("position","relative");
We will first add the heading to our graph from the option provided in a h3 tag which has a ui-helper-reset class which is a mini reset class for elements provided by jQuery UI,then we will add the widget header class. After that we will set the dimensions of root’s parent and set it’s position to relative.
Reason of setting position relative is so that absolute positioned elements which we will be using later can adjust themselves with respect to the parent, if its not given to relative the bars will be all over the page 😉 .
Step 6
Now we are going to declare variables that we are going to use later and lastly we will select the maximum value available in the data, since that will be our highest scale.
var i=0,max_val=0,scale,datalen=0,temp,w;

	for(i=0;i<options.data.length;i++)
	{
		if(options.data[i]>=max_val)
		max_val = options.data[i];
	}
Step 7
Now we will create a scale. For that we will divide the graph into equal parts, by dividing it’s height by data length. Then we will initialize i variable with height for later use. Then we are going to create two div elements. One will be the graph background and other will be bars of the graph.
scale = options.height/options.data.length;
	i=options.height;
	var bg = jQuery("<div />",{ css:{height:scale - 1 }  }).addClass("ui-helper-reset ui-widget-bg");
    var bar = jQuery("<div />",{ css:{width:width}  }).addClass("ui-helper-reset ui-state-active bar");
	var width = Math.floor((options.width-70)/options.data.length - (options.categories.length/1.5));
In the bg element we have added the ui-widget-bg class that we had manually created in the css file. Note that here height is scale -1, -1 is added because we have added a 1px solid top border. If we had not added the border, scaling would be disturbed. For the bar elements we have added active state class and a bar class that we will later use in events.
Step 8
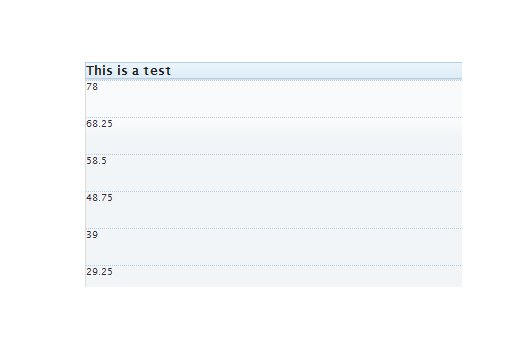
Now we are going to add the gridlines to our graph. For that we will add bg elements to our graph that have equal height. We will also add per unit values in it. The values will be in respect to the original values that we have supplied not the scaled values.
var counter = 0;

	while(i>=0)
	{
		temp = bg.clone().html(max_val - counter);
		root.append(temp);
		i = i - scale;
		counter = counter + max_val/8;
		datalen++;
	}
So far our progress looks like –
Step 9
Now we will add bar graphs, first of all we will loop all the values then we will calculate the height of the bar graph on our scale. Then we will add the bar with the calculated height and distance from the orgin with label as html.
w= 40;

	 for(i=0;i<options.categories.length;i++)
	   {

		temp =  Math.floor(options.data[i]/max_val * datalen * scale ) - scale;
		root.append(bar.clone().css({height:temp,left:w}).html(options.categories[i]));

		w = w + width + 10;

	  }
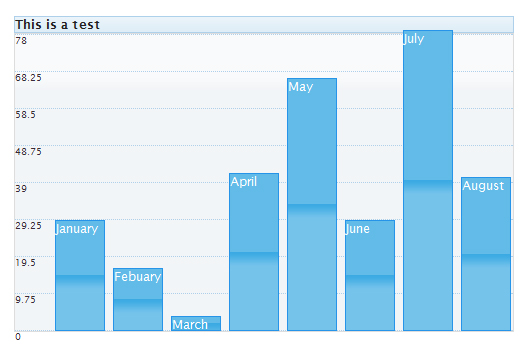
Now our graph looks like –
Step 10
Finally we will add hover event for the bars , with some effects. When mouse hovers on a bar, other bars gets ui-priority-secondary class which reducts its opacity with respect to the hovered bar. Also we will add ui-state-hover on hovered bar.
$(".ui-widget-bg:last").css("height",0);
	$(".bar").hover(function(){

					   $(this).toggleClass('ui-state-active ui-state-hover');
					   $(".bar").not(this).addClass('ui-priority-secondary');

					   },function(){

						   $(this).toggleClass('ui-state-active  ui-state-hover');
						$(".bar").not(this).removeClass('ui-priority-secondary');
						   });
Step 11 – Calling the plugin
Now comes the easy part, just call the plugin in the html we had imported our scripts earlier thats it !!
<script type="text/javascript">
$(function(){
		   var d = [34,23,12,45,67,34,78,44];
		   var c = ["January","Febuary","March","April","May","June","July","August"];
		   $("#graph").graph({data:d,categories:c,legend:"This is a test"});

		   });

</script>
When you’ve got any questions regarding this tutorial, please don’t hesitate to ask. And when you enjoyed this tutorial, then we would appreciate it when you could spread the word about it.
This entry was posted on Wednesday, June 30th, 2010 at 17:26 and is filed under Tutorials. You can follow any responses to this entry through the RSS 2.0 feed. You can leave a response, or trackback from your own site.
nice graphs
Great tutorial ,thanks for share
I found your script easy to understand. however, im unclear about which file to add the codes of steps 3-8 to. Could you please let me know as soon as possible?
The [STEP 10] “hover” event do not seem to work :
-Tested on Firefox 3.6.x, Internet Explorer 8 with
a local downloaded and verified code and with your
online live demo.
Any idea or hint about that ?
thanks for nice and helpful post.
Great tutorial…1 question though…
In the example, you set January = 34, but in the graph then it will set January to 29.25 and so on with the other value…can you explain on this?
Nice article.
Thank you